Statistics Page
As a Premium Creator, it is important to understand your metrics to help shape your brand. You can use the Statistics Page to view your sales by feature, community engagement and receive payouts.
How to Use Statistics
Finding the Statistics page
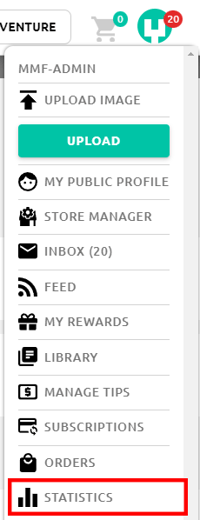
To access the statistics page, hover over your avatar on the top right of the MyMiniFactory page and click on “Statistics” on the drop-down menu:
Understanding your metrics
On the statistics page, you will see several tabs, each showing detailed data from different parts of your store.

Overview
The Overview section gives you a clear snapshot of your performance across Store, Tribes, and FronTiers. You can see total earnings, new customers, average discounts, audience locations, live campaign funding, your current supporter count, and your available balance. Each metric includes a tooltip that explains what it measures.

Store Tab
The Store section focuses on your direct sales. It shows your earnings over time, the impact of discounts, and which price ranges bring the strongest results. The monthly and weekly heatmaps help you spot when your customers are most active so you can understand consistent patterns and seasonal behavior.
.gif?width=688&height=314&name=ezgif.com-resize%20(11).gif)
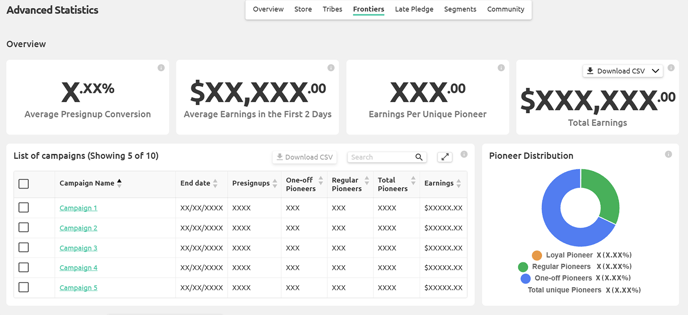
Tribes Tab
The Tribes section covers everything related to your subscription community. It tracks changes in active subscribers, how long people stay subscribed, daily earnings from Tribes, and your churn and loyalty rates. This helps you understand retention and long-term community stability.

FronTier Tab
The FronTiers section summarizes your campaign activity. You can see total funding raised, your number of pioneers, and how well presignups convert into actual backers. Tier and add on tables show which offers perform best, and the pioneer distribution helps you understand supporter loyalty across different campaigns.

Late Pledge Tab
The Late Pledge section works like FronTiers but focuses on performance after a campaign ends. It shows unique backers, total late pledge revenue, and the average contribution per backer.

Community Tab
The Community section brings together your engagement stats across the platform, including comments, likes, followers, and prints. This gives you a quick sense of how your audience interacts with your work.
For clear definitions of any metric, hover over the tooltips on the dashboard. Each one explains how the number is calculated and what it represents.

Earnings
Your earnings are an important element of your Statistics page.
To access your earnings, hover over your avatar on the top right of the MyMiniFactory page and click on “Earnings” on the drop-down menu:

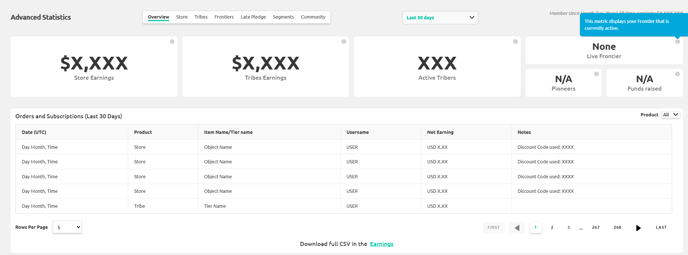
You can also access the Earnings page from the bottom of the Statistics page here
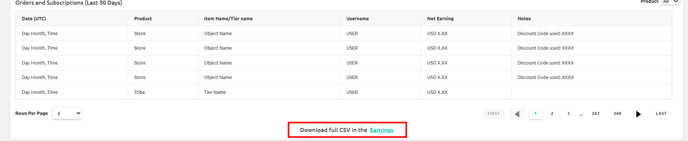
FAQ
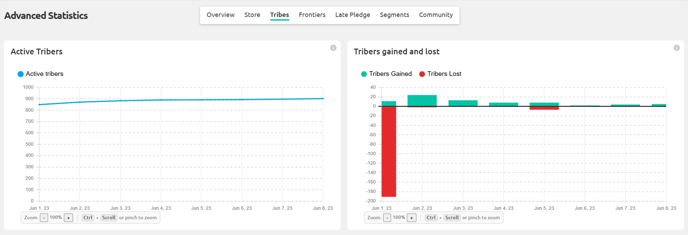
Why does the zoom feature on the graph change when I adjust the filter?
The graph relies on the filter at the top of the page. If you change it from Last 30 Days to All time, the graph recalculates based on the new selection.
Why is the balance displayed at the bottom of the page?
The balance is more closely linked to the Earnings page, so it is placed at the bottom. The number also links back to the Earnings page for quick access.
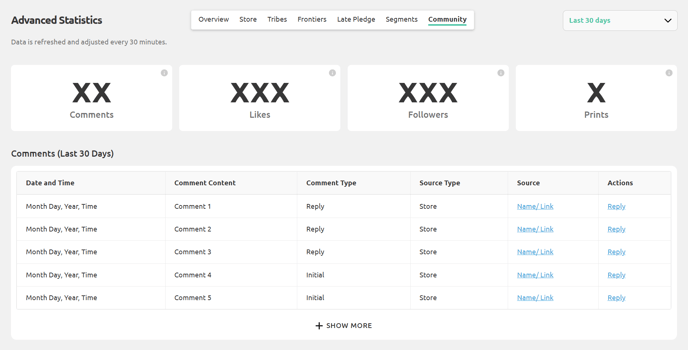
Why are Last 30 Days for comments and orders not affected by the main filter?
Some Creators have thousands or even tens of thousands of comments and orders. Letting the filter recalculate all of that would slow the page significantly, so it stays fixed at 30 days to keep the dashboard fast and responsive.